Grafana 入门指南
本指南展示了如何安装、配置、启动 Grafana,及简单使用说明。
下载 Grafana
请根据当前的操作系统,到 Grafana 官网下载安装包,并执行安装。
- 下载地址:https://grafana.com/grafana/download
- 根据自己情况选择版本号(Version)、版本类型(Edition)、对应操作系统版本
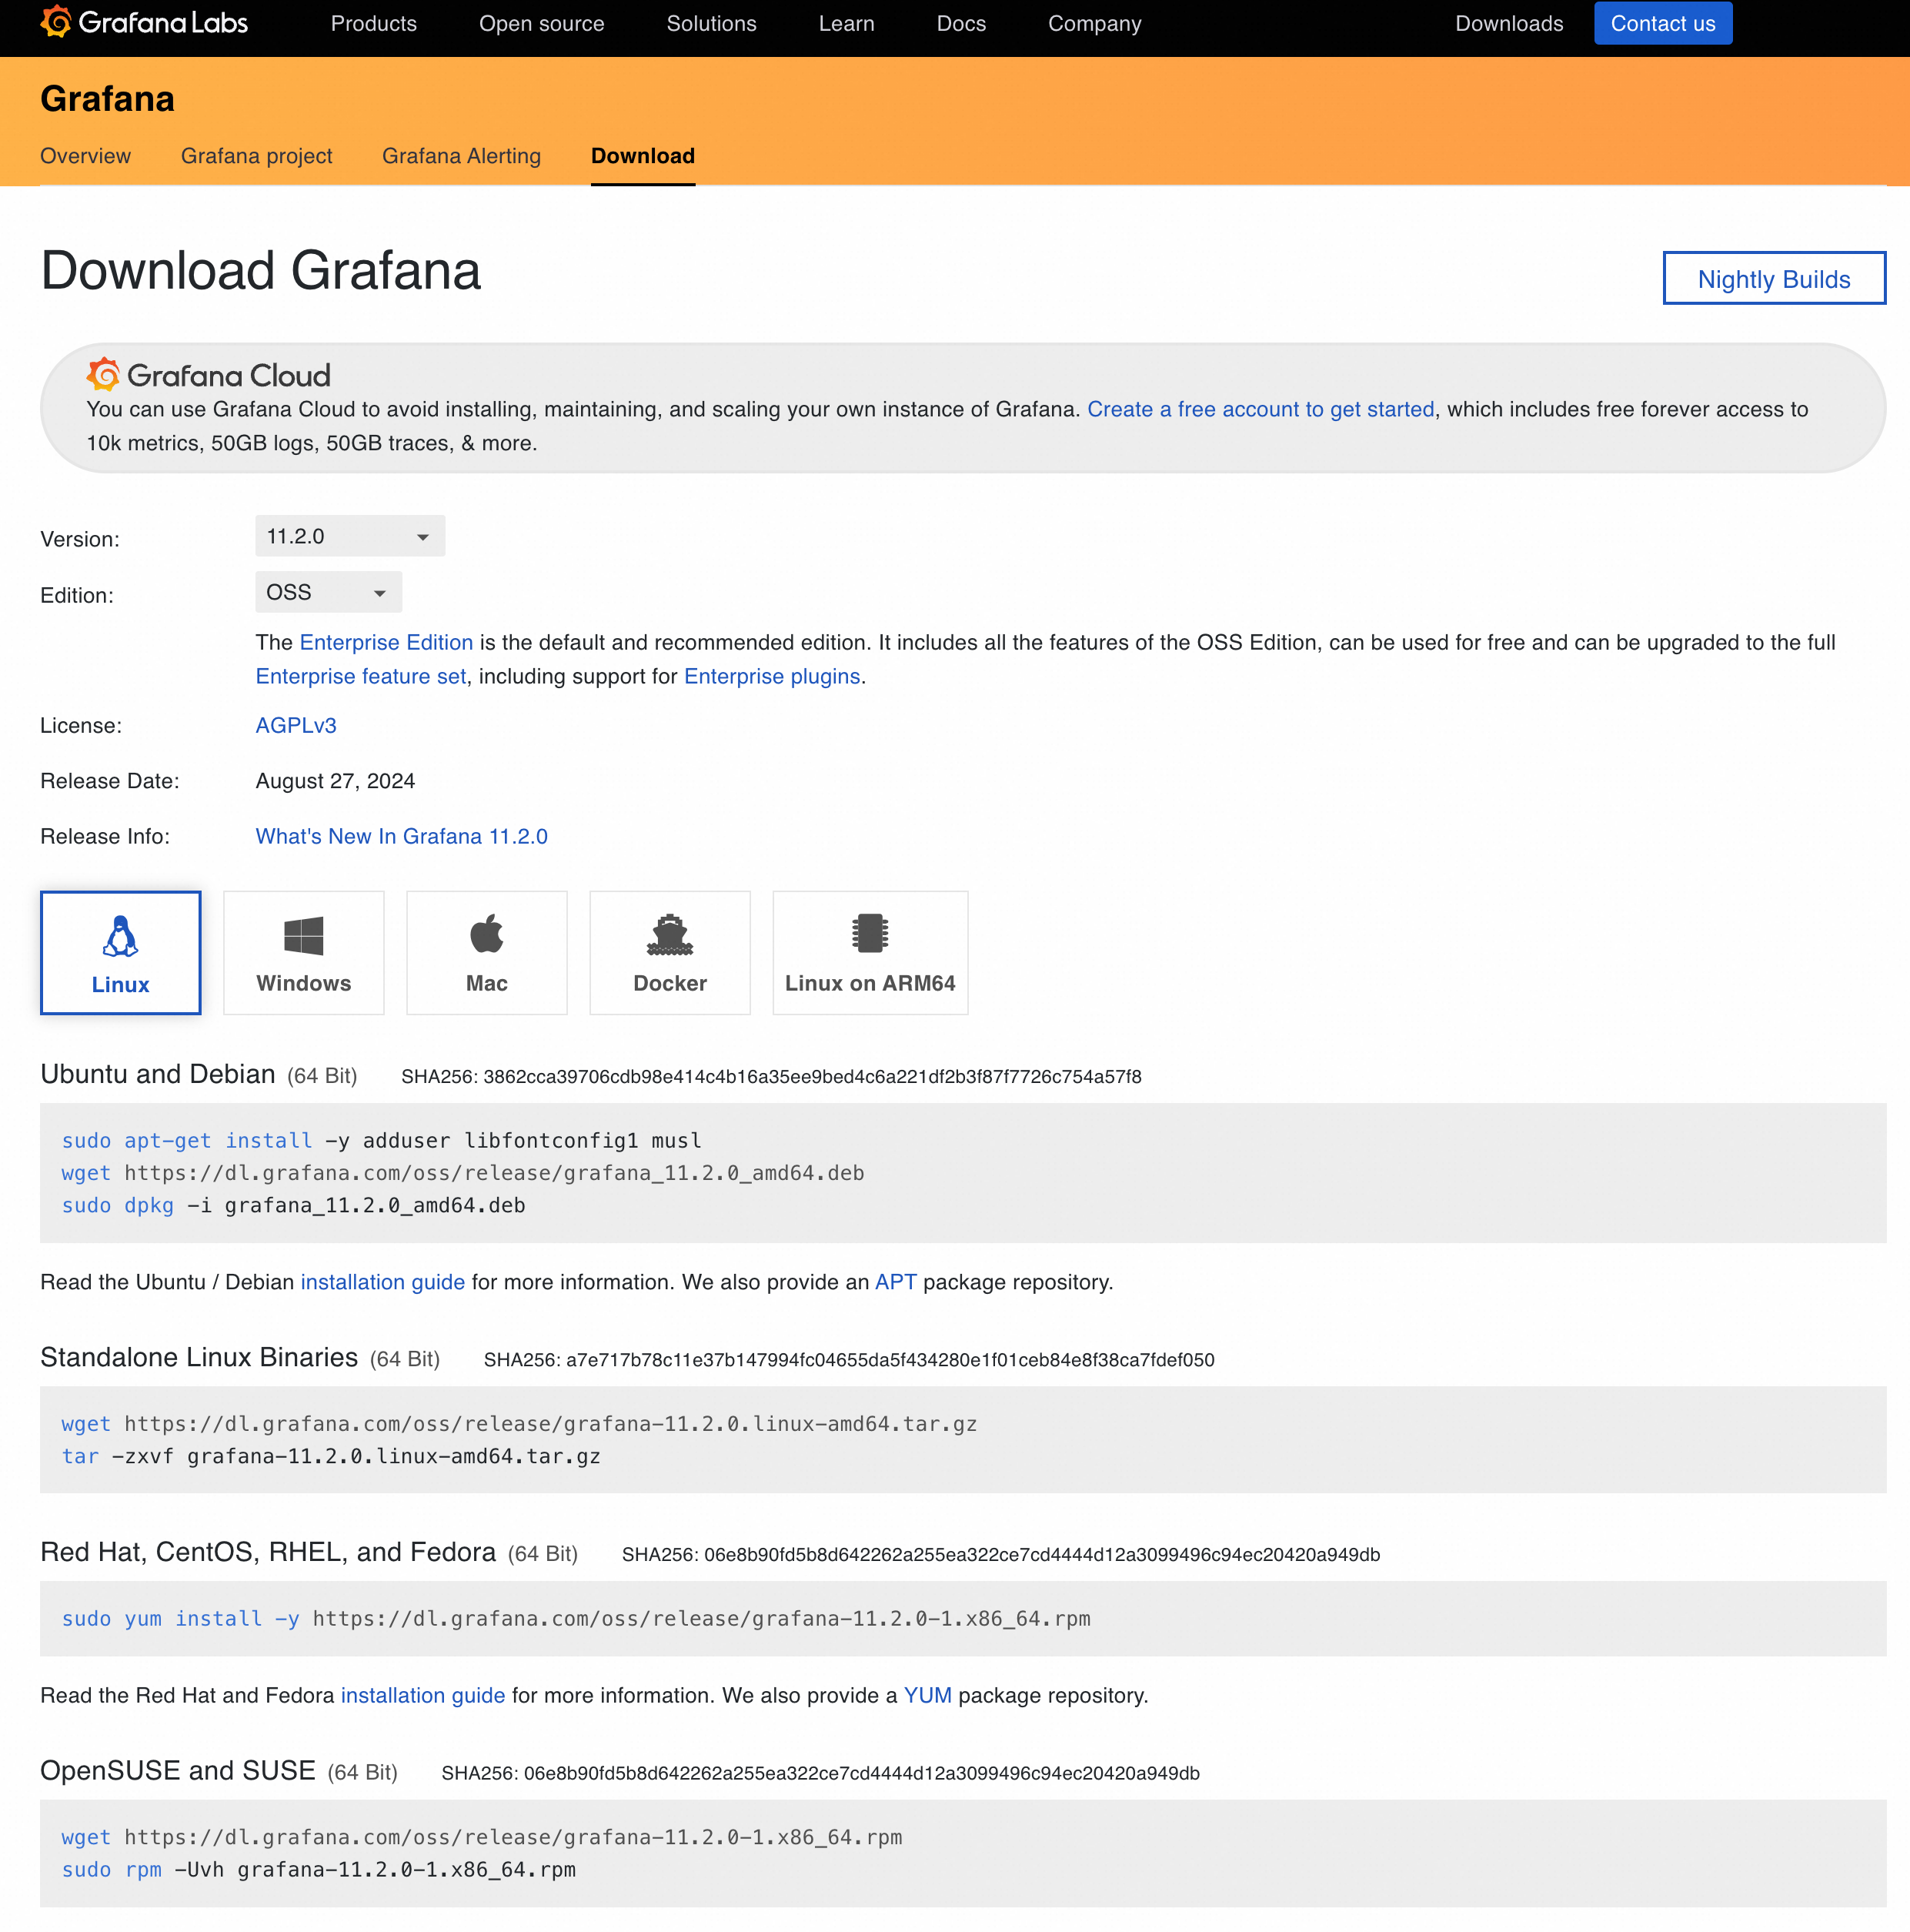
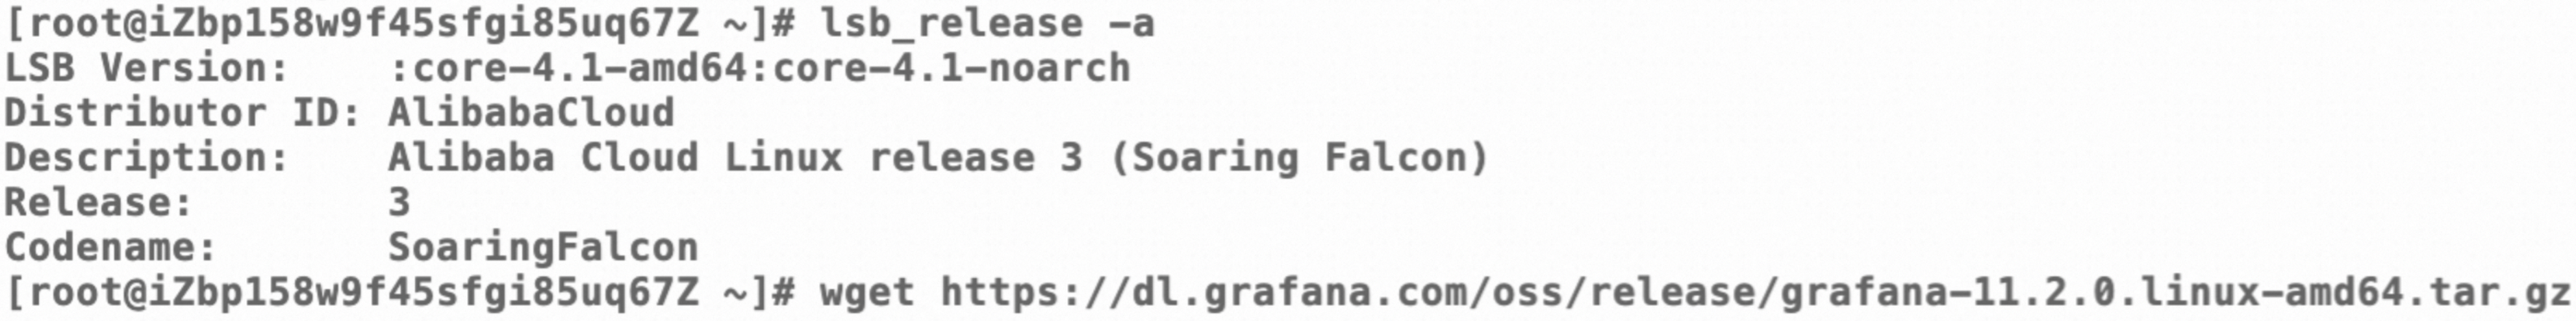
本文以阿里云ECS(Alibaba Cloud Linux)为例,Grafana下载选项设置为 Version:11.2.0,Edition:OSS,下载并解压
wget https://dl.grafana.com/oss/release/grafana-11.2.0.linux-amd64.tar.gztar -zxvf grafana-11.2.0.linux-amd64.tar.gz- 查询操作系统版本并下载Grafana
- 解压Grafana压缩文件
- 查看解压文件目录


配置 Grafana
检查并根据自己需要修改Grafana配置,Grafana配置文件名defaults.ini
cd /root/grafana-v11.2.0/conflscat defaults.ini常用配置说明:
- [database] 数据库相关配置,默认是sqlite3,可以根据自己需要修改为MySQL数据库。
[database]# You can configure the database connection by specifying type, host, name, user and password# as separate properties or as on string using the url property.
# Either "mysql", "postgres" or "sqlite3", it's your choicetype = sqlite3host = 127.0.0.1:3306name = grafanauser = root- [server] 服务启动相关参数,如端口号、域名 等。
[server]# Protocol (http, https, h2, socket)protocol = http
# Minimum TLS version allowed. By default, this value is empty. Accepted values are: TLS1.2, TLS1.3. If nothing is set TLS1.2 would be takenmin_tls_version = ""
# The ip address to bind to, empty will bind to all interfaceshttp_addr =
# The http port to usehttp_port = 3000
# The public facing domain name used to access grafana from a browserdomain = localhost

# The full public facing urlroot_url = %(protocol)s://%(domain)s:%(http_port)s/- [paths] 启动文件加载目录,如日志路径、插件加载路径等。
[paths]# Path to where grafana can store temp files, sessions, and the sqlite3 db (if that is used)data = data
# Temporary files in `data` directory older than given duration will be removedtemp_data_lifetime = 24h
# Directory where grafana can store logslogs = data/log
# Directory where grafana will automatically scan and look for pluginsplugins = data/plugins
# folder that contains provisioning config files that grafana will apply on startup and while running.provisioning = conf/provisioning- [security] 安全相关配置,如管理员账号、密码等。
[security]# disable creation of admin user on first start of grafanadisable_initial_admin_creation = false
# default admin user, created on startupadmin_user = admin
# default admin password, can be changed before first start of grafana, or in profile settingsadmin_password = admin
# default admin email, created on startupadmin_email = admin@localhost- [users] 用户相关配置,如默认语言、默认页面样式、默认主页、登录会话超时时间等设置。
[users]
# Default UI theme ("dark" or "light" or "system")default_theme = dark
# Default UI language (supported IETF language tag, such as en-US)default_language = en-US
# Path to a custom home page. Users are only redirected to this if the default home dashboard is used. It should match a frontend route and contain a leading slash.home_page =
启动 Grafana
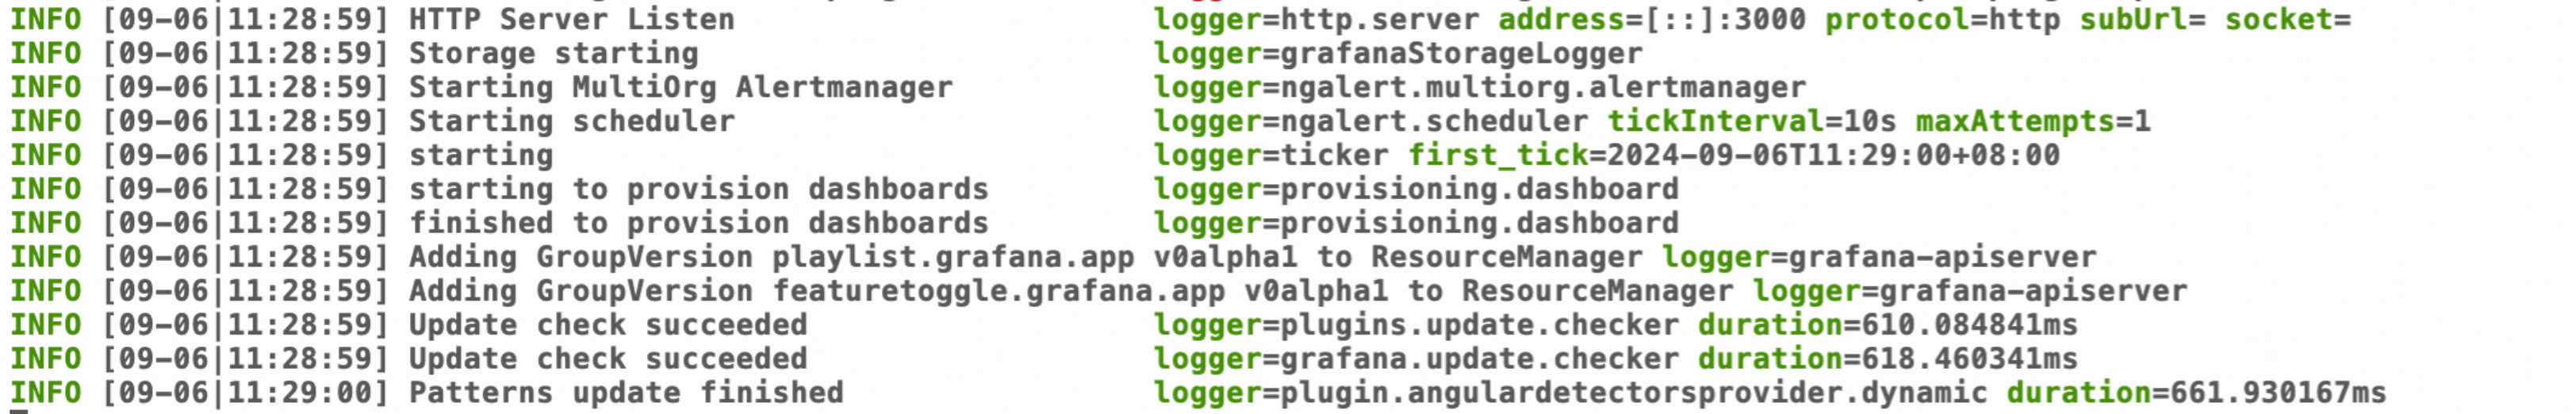
进入bin目录执行启动命令,启动Grafana
cd /root/grafana-v11.2.0/binls./grafana-server看到如下日志则表示Grafana启动成功
管理 Grafana
登录Grafana:
在浏览器输入http://你的ECS_IP:3000 进入Grafana登录页面。输入账号及密码登录Grafana 。
默认账号:admin 密码:admin

登录Grafana后,接下来可以进行Grafana的基本功能管理。
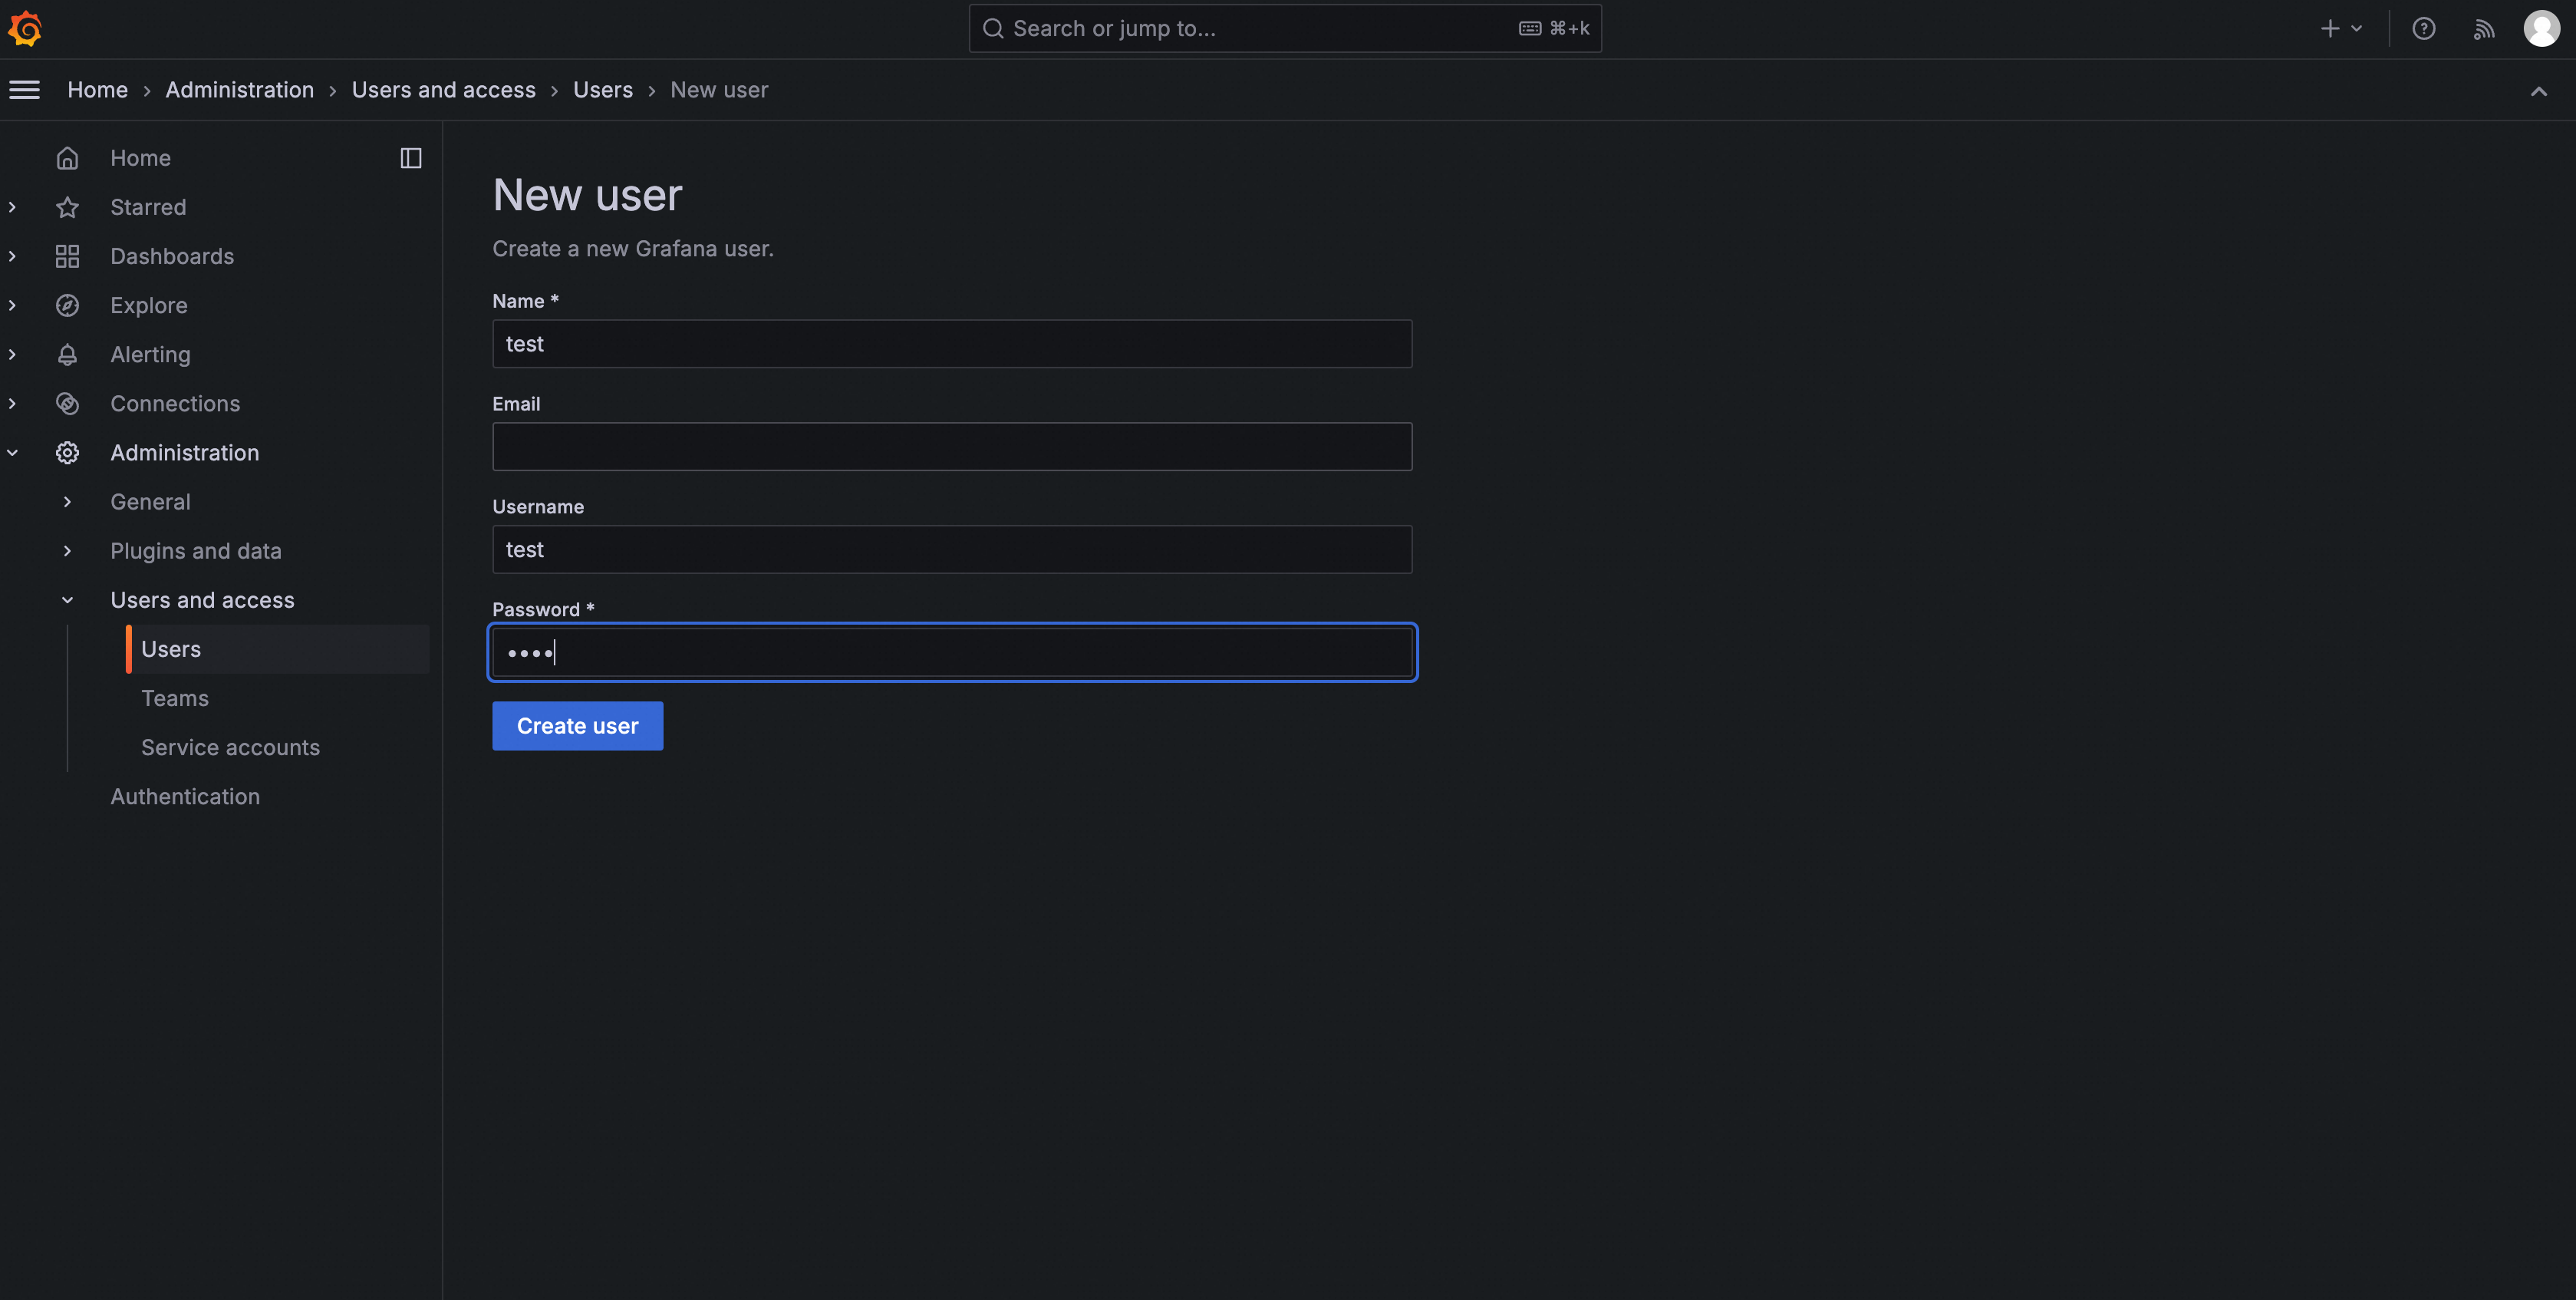
管理账号:
在菜单Home > Administration > Users and access 中点击New user 添加用户,并根据需要授予不同权限Admin、Editor、Viewer 。


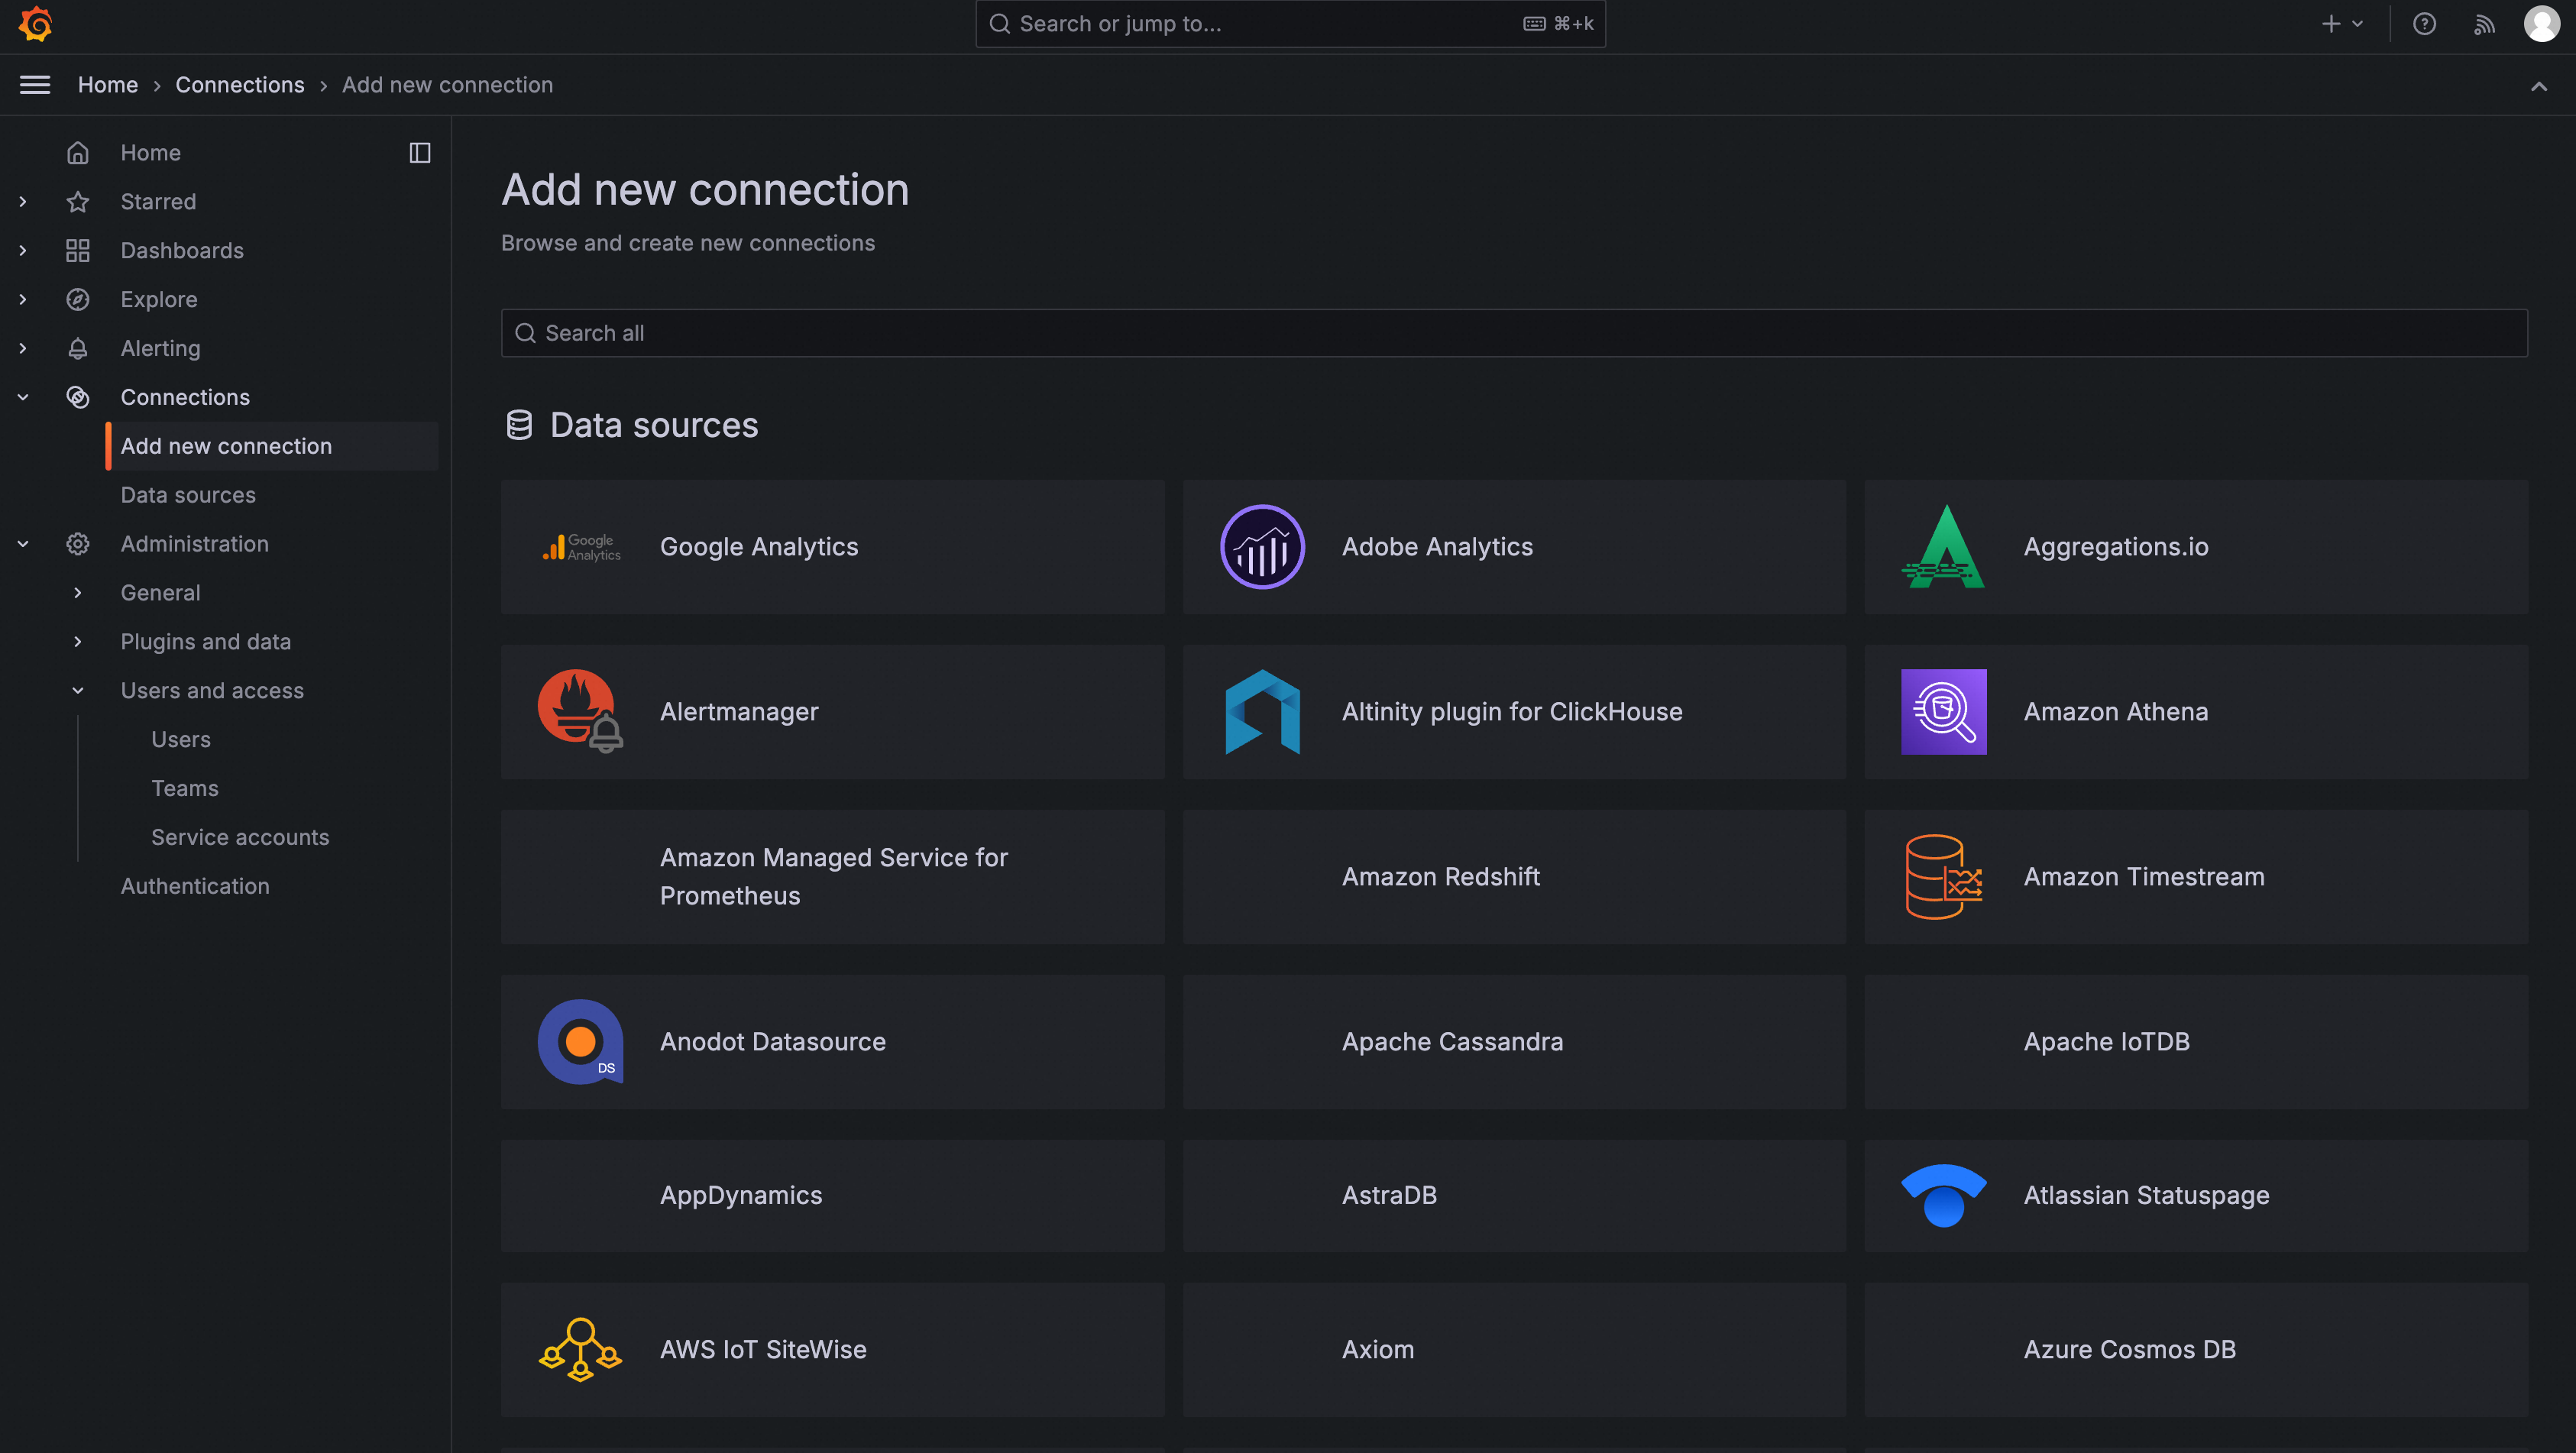
创建数据源:
在菜单Home > Connections > Add new connection 中找到自己需要的数据类型,在详情页点击Add new data source 进行添加,此处以Prometheus 为例 。

- 填写URL并保存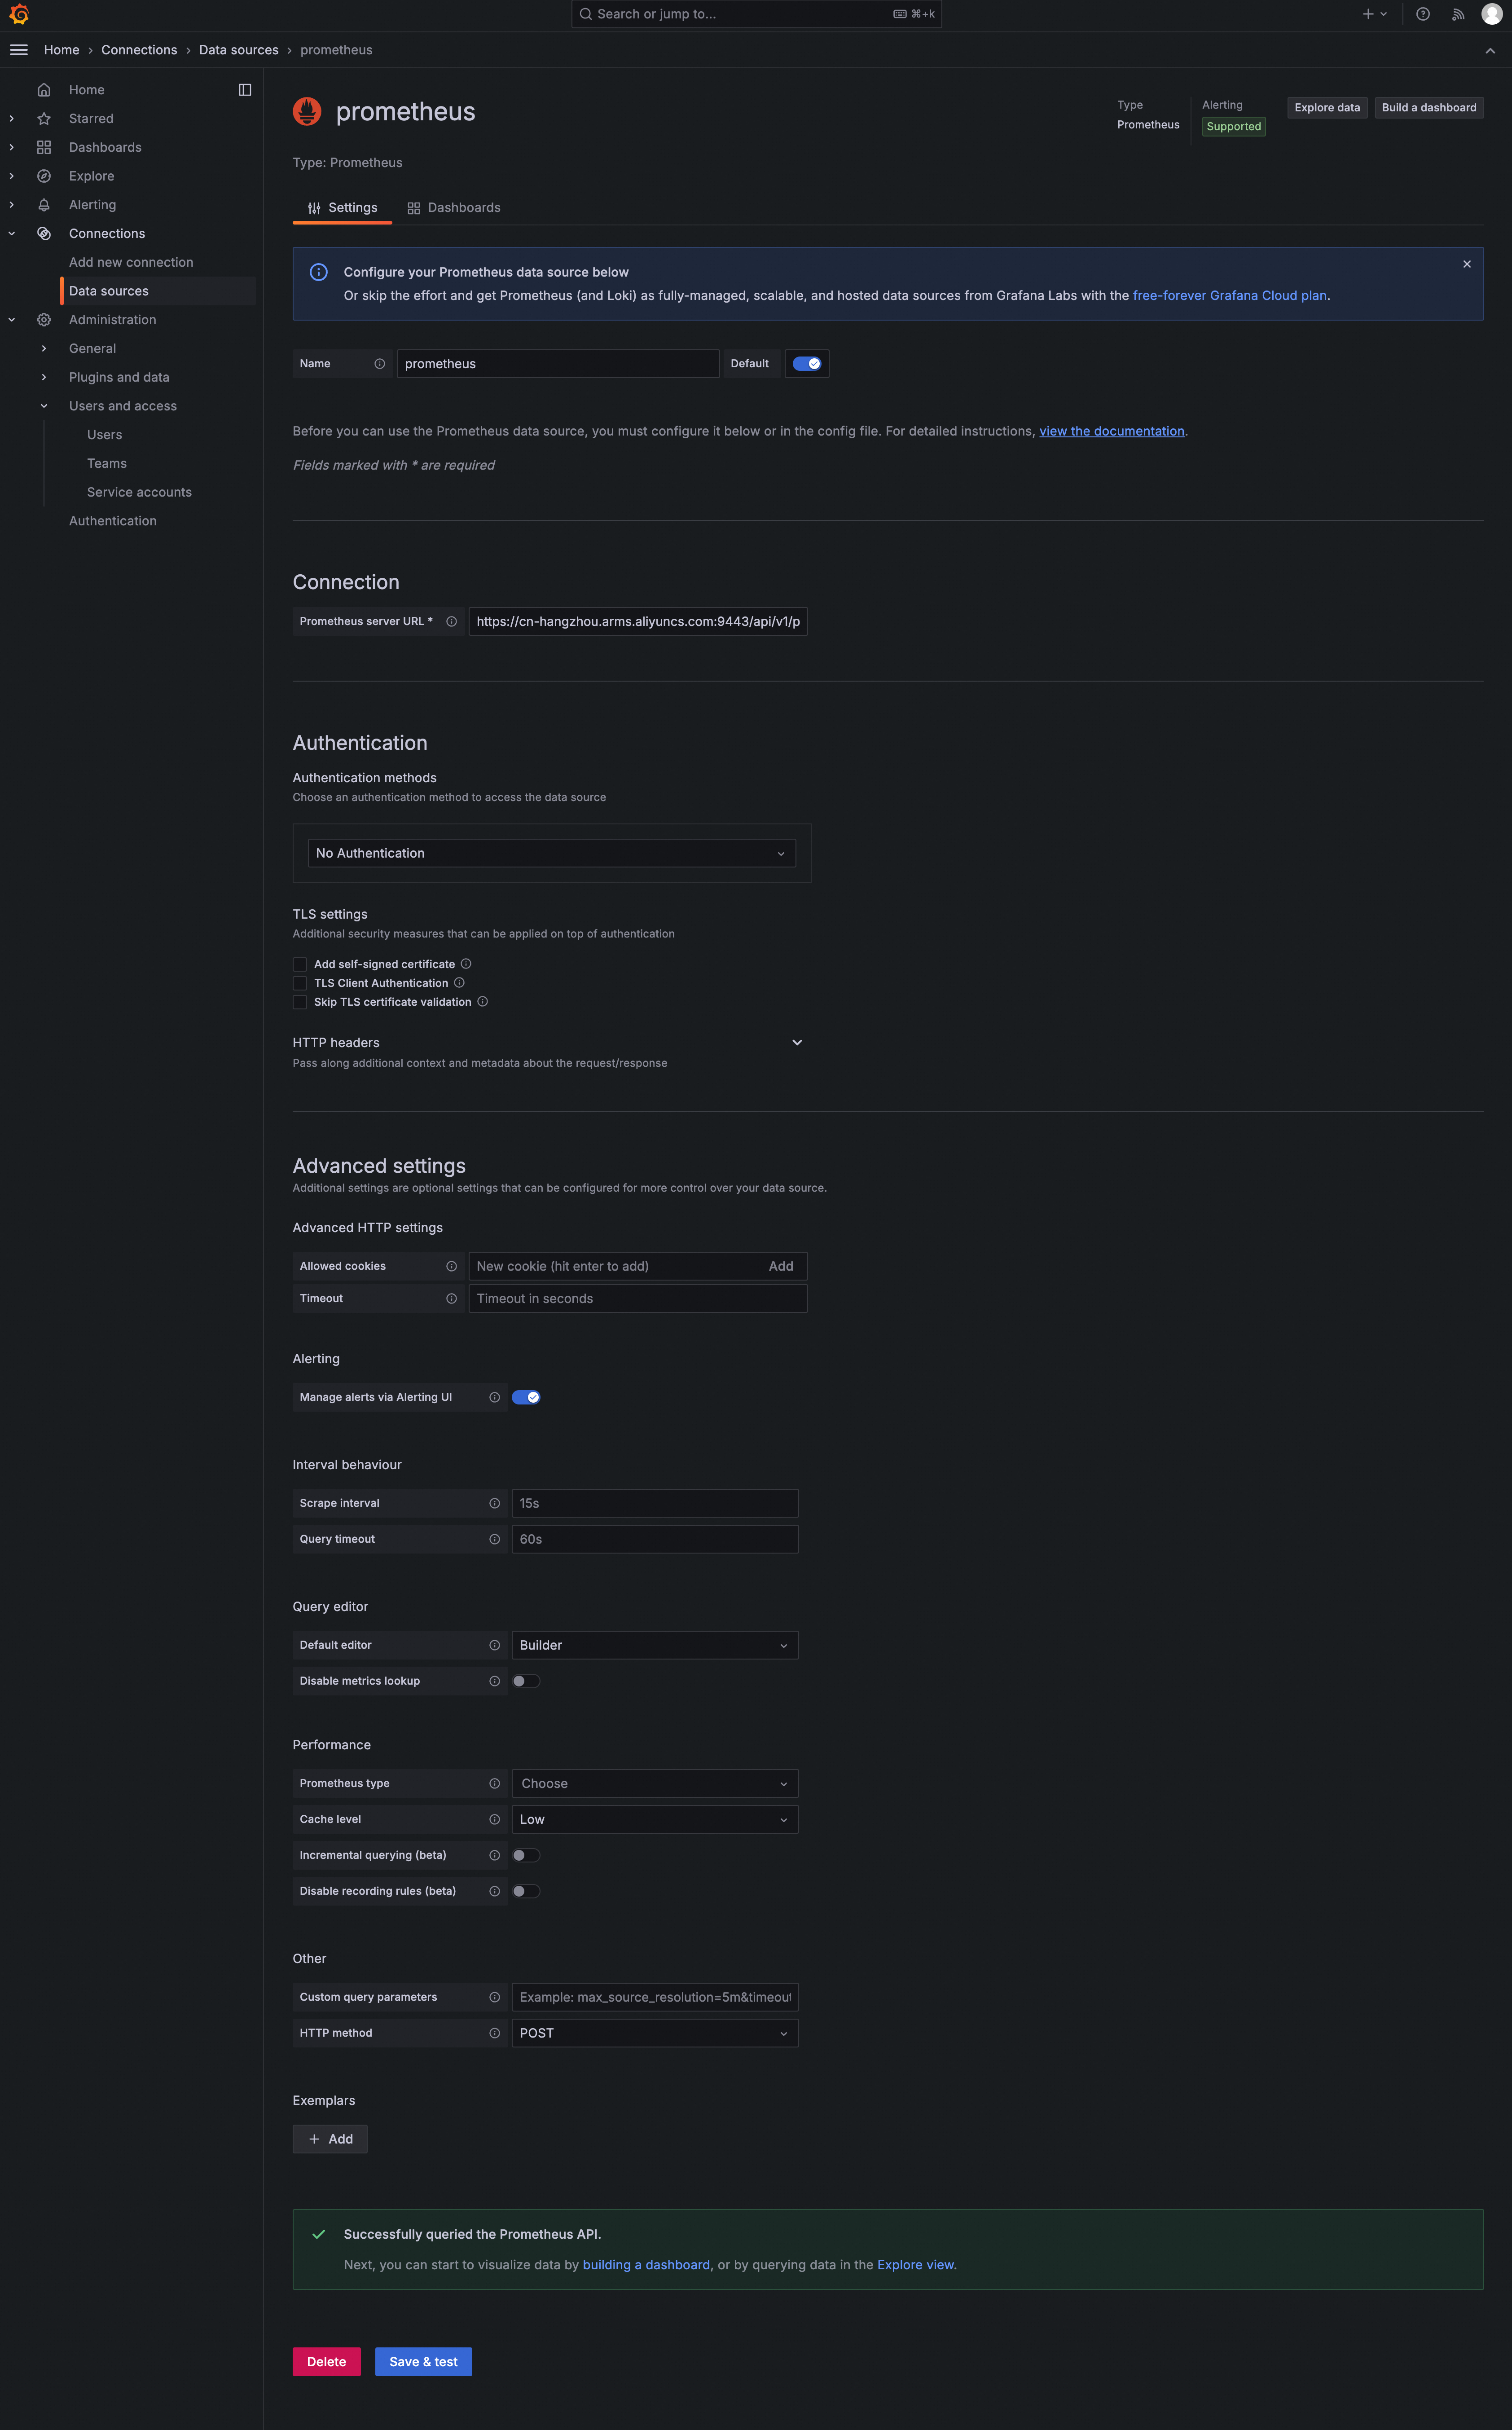
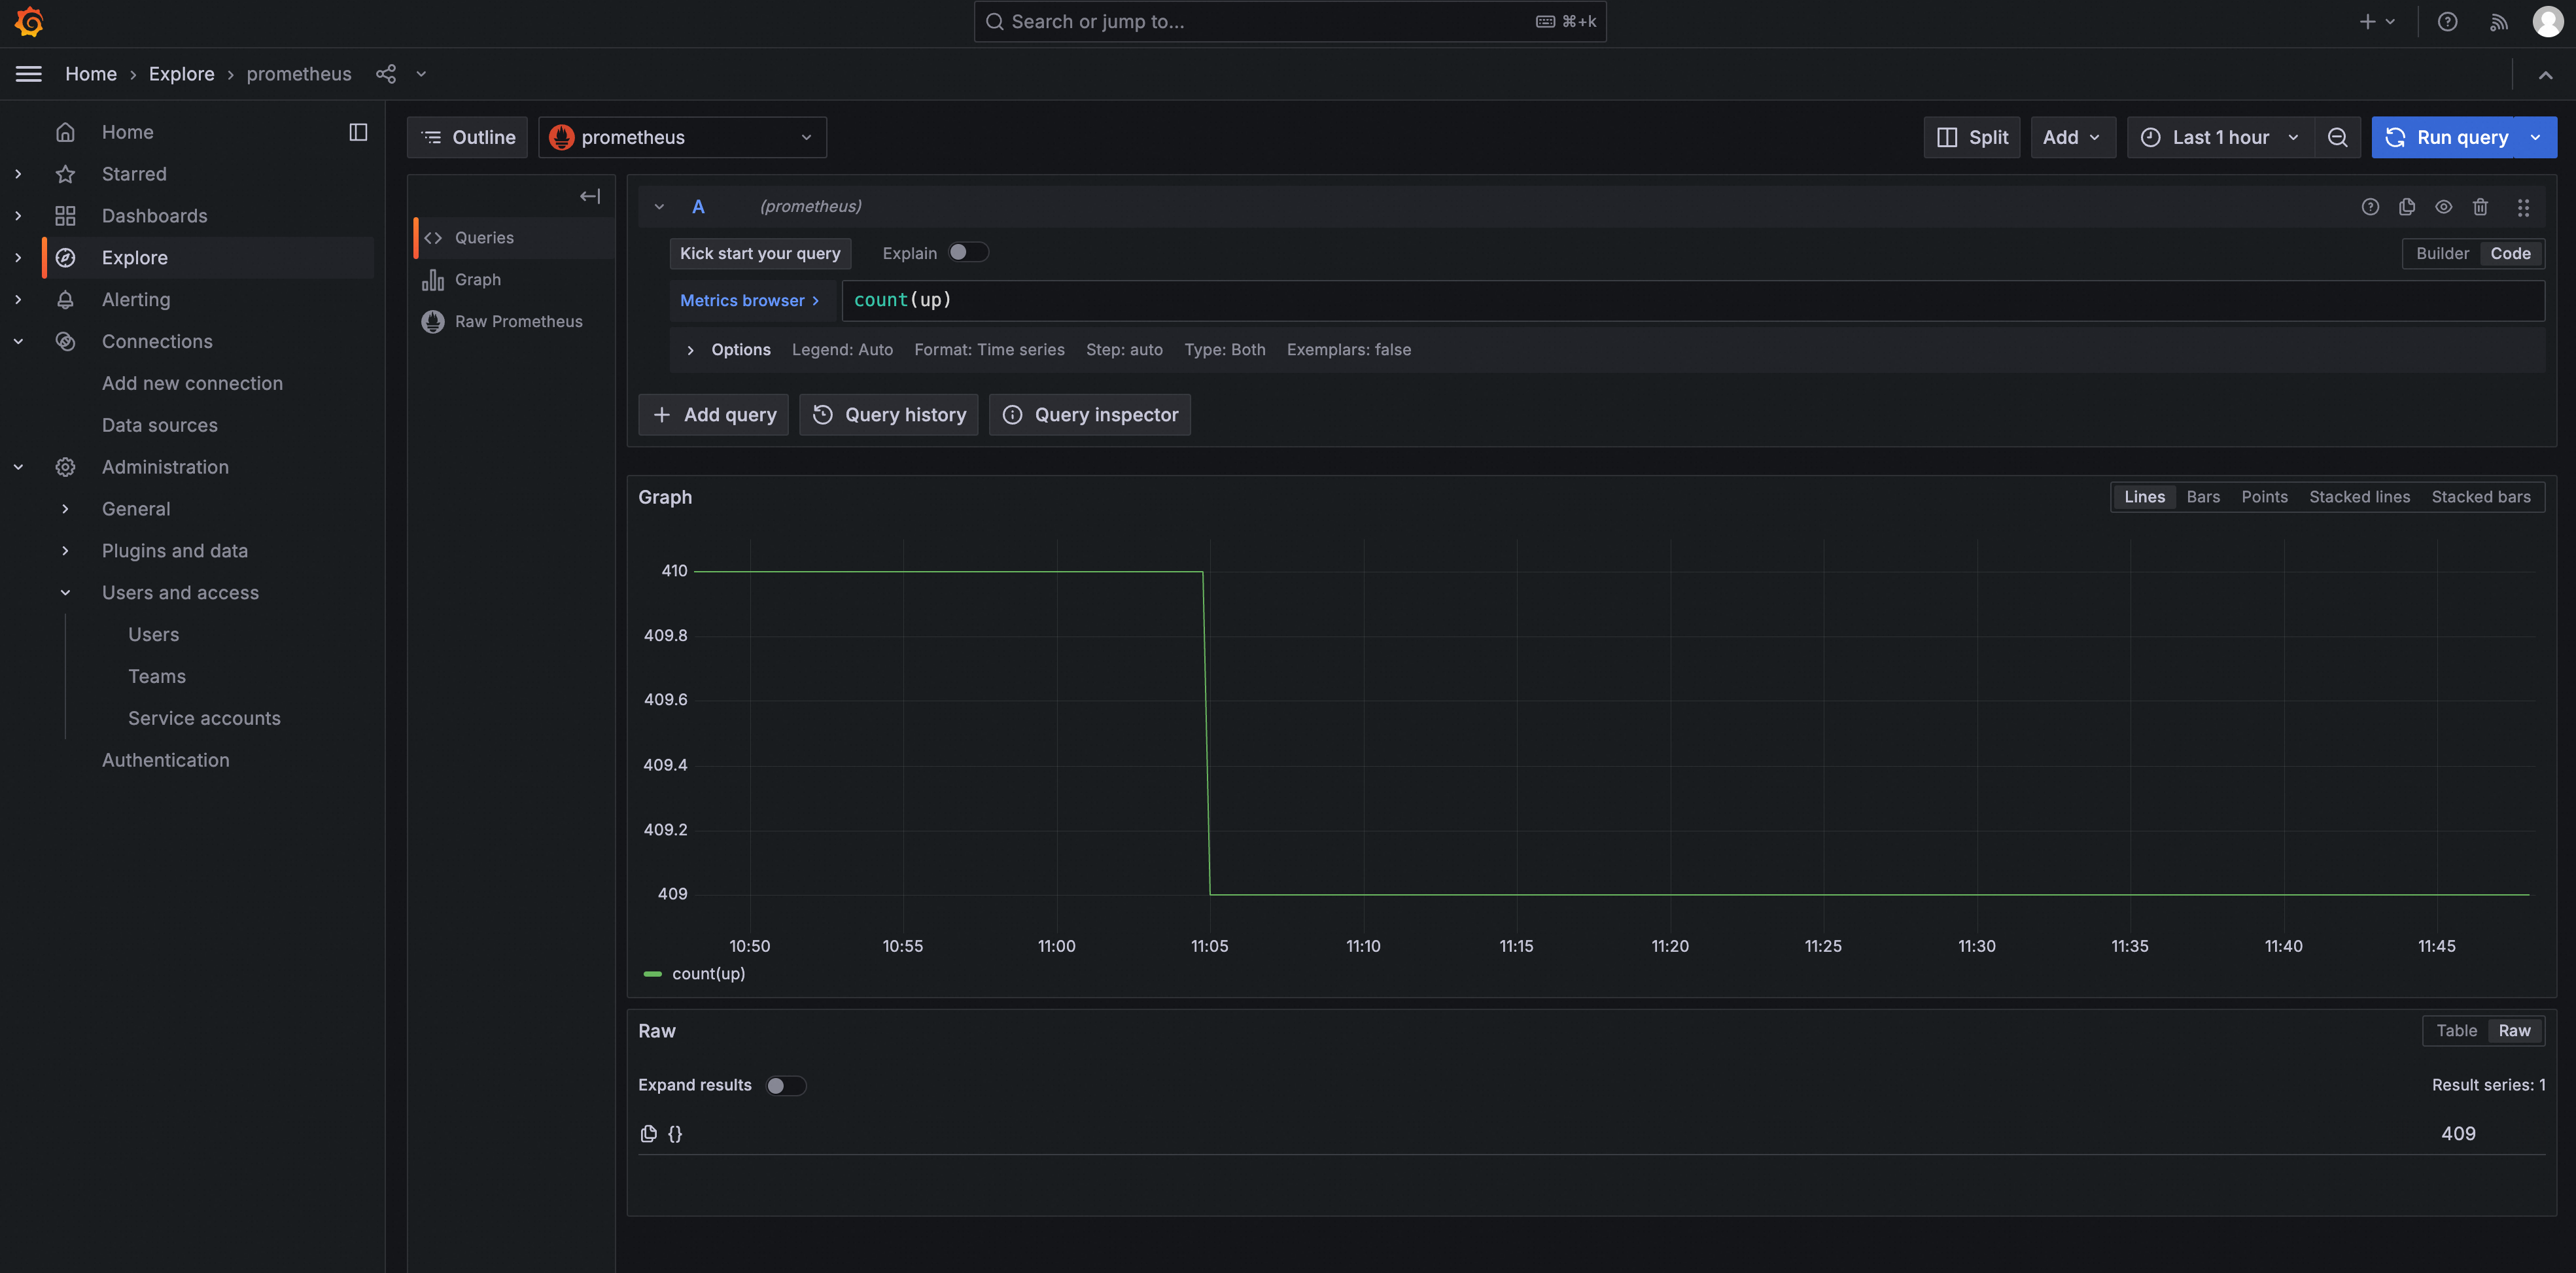
Explore探索数据:
在菜单Home > Explore 中找到上一步创建的Prometheus数据源,填写查询语句后点击Run Query 执行即可看到数据。
创建Dashboard:
在菜单Home > Dashboard 中点击Create dashboard创建Dashboard,再点击Add visualization添加视图并选择上一步创建的Prometheus数据源,填写查询语句后点击Run Querys 执行即可看到数据。最后点击Save按钮保存配置。


